Email marketing can feel like guesswork if you’re not paying attention to the right numbers. You send a campaign, and then what? Maybe it hits an inbox. Maybe spam. Or maybe it’s ignored entirely! The question is: do you know where yours are landing, and why?
You could if you tracked the right engagement metrics. Open rates, click-through rates, and spam complaints aren’t just random numbers; they’re signals.
Signals that tell you how compelling your subject lines are or if your CTAs are actually getting clicks. Skip them, and you risk sending emails into a black hole of irrelevance. Use them, and you’ve got the keys to something far more powerful than luck.
So, how do you decode these signals and put them to work? Keep reading to find out…
Key Email Engagement Metrics to Monitor
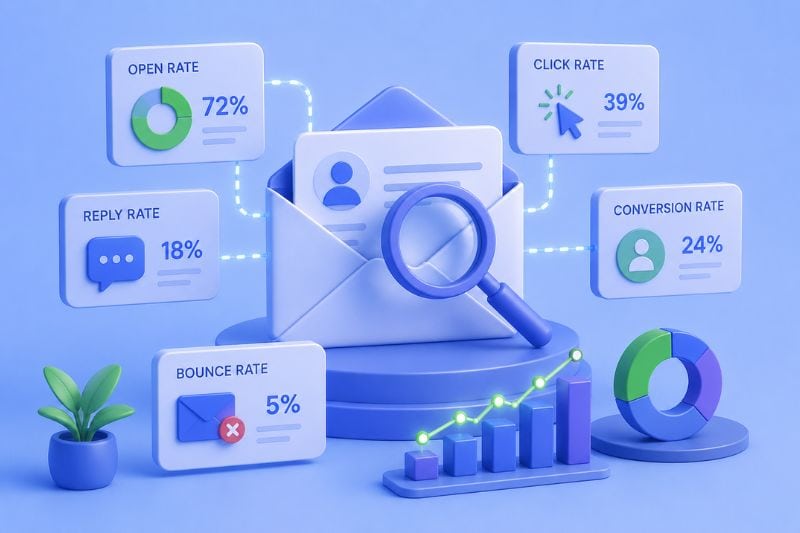
Here are the email engagement metrics that marketers should pay closest attention to:
- Open rate: The percentage of recipients who open your emails.
- Click-through rate (CTR): The percentage of delivered emails that generate at least one click.
- Click-to-open rate (CTOR): The percentage of opens that result in clicks.
- Bounce rate: The percentage of emails that fail to reach recipients’ inboxes.
- Spam complaint rate: The percentage of recipients who mark your emails as spam.
- Unsubscribe rate: The percentage of subscribers who opt out after receiving an email.
- Conversion rate: The percentage of recipients who complete a desired action after engaging with your message.
The sections below explain what each metric means, why it matters, and how to improve it.
The Foundations: What Engagement Metrics Really Measure
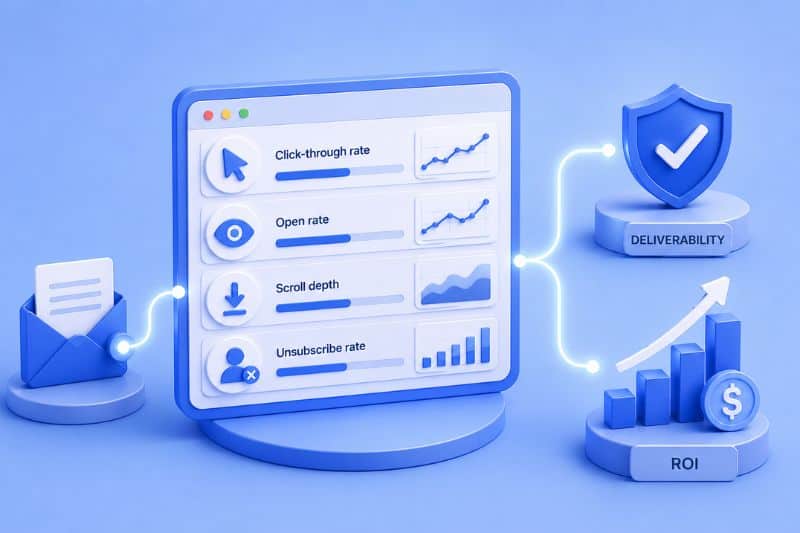
Email engagement metrics are your way of understanding what your audience is really doing—clicking through, scrolling past, or unsubscribing altogether. However, their real value lies in the connections they draw to the bigger picture: deliverability and ROI.
Good engagement metrics signal inbox providers like Gmail and Outlook that you’re a sender worth trusting. Trust leads to better deliverability, meaning more emails land in the inbox instead of spam. But weak engagement, such as high bounce rates or spam complaints, can tank your sender reputation and make it harder to reach your audience.
If that happens, InboxAlly can help turn things around: better sender reputation, better deliverability, and more of your emails landing at the top of inboxes. Try it and see the difference.
ROI is the other side of this equation. Metrics like open rate (who’s opening), click-through rate (who’s clicking), and bounce rate (who’s not even receiving) show you how well your campaigns turn attention into action. High engagement often means better conversions and better conversions lead to higher revenue per email—simple as that.
Open Rates: The Double-Edged Sword of Engagement
Marketers often start with open rates, and it makes sense. They tell you if your emails are grabbing attention. But here’s the catch: open rates don’t always give you the full picture. Thanks to Apple Mail Privacy Protection, some emails show as “opened” even if the recipient never laid eyes on them.
Still, open rates hold their value when you use them alongside other email marketing metrics. For example, a high open rate but a low click-to-open rate (CTOR) likely means your subject line did its job, but your email content didn’t follow through.
Now, a couple of things can steer you in the right direction:
- Subject line A/B testing: Play with curiosity, personalization, or urgency to see what hooks your audience.
- Send-time optimization: Analyze past data to find when your readers are most active.
- Preview text hacks: Treat the preheader as an extension of your subject line. A compelling snippet can make all the difference.
Open rates may have their quirks, but they’re far from useless. Paired with deeper metrics and a bit of strategy, they can guide you toward great results.
How To Calculate Open Rates
(Unique Opens ÷ Delivered Emails) × 100
Click-Through and Click-to-Open Rates: The True Test of Email Relevance
Click-through rate (CTR) and click-to-open rate (CTOR) go beyond the surface-level metrics of email engagement. CTR tells you how many recipients clicked on a link out of all emails delivered, while CTOR narrows the focus to those who actually opened the email. This makes CTOR a better tool for judging how well your content resonates with those who take a look.
Here’s how they work together: if CTR is low but CTOR is high, your content is likely good, but your subject line or preheader might be the weak point. On the other hand, if both are low, it’s time for a rethink—messaging, design, or both.
To improve these metrics, focus on clarity and intention:
- Email layout: A clean, simple design with a clear content flow keeps readers engaged. Overly cluttered designs confuse readers and dilute engagement.
- CTA placement: Place your primary CTA where it’s easy to spot—above the fold and supported by additional CTAs placed naturally throughout the email.
- Visuals and design: Use buttons instead of plain links, optimize for mobile, and guide the eye with whitespace or subtle visual cues.
As for industry benchmarks, aiming for a 2-5% CTR and a 6-17% CTOR is a solid start. But the real goal is alignment—if your email drives clicks and matches expectations, you’re doing it right. Fine-tune these elements, and you’ll see your engagement take off.
How To Calculate Click Through Rates
(Unique Clicks ÷ Delivered Emails) × 100
How To Calculate Click-to-Open Rates
(Unique Clicks ÷ Unique Opens) × 100
Conversion Rate: Turning Engagement Into Action
While opens and clicks tell you whether subscribers are interacting with your emails, the conversion rate reveals whether those interactions lead to meaningful outcomes.
Conversion rate measures the percentage of recipients who complete a desired action after engaging with your email. Depending on your goals, that action could include making a purchase, booking a demo, downloading a resource, registering for an event, or starting a free trial.
A strong conversion rate indicates alignment between your email content, call to action, and landing page experience. If clicks are high but conversions are low, it may signal friction after the click, such as confusing messaging, a poor user experience, or an offer that doesn’t match subscriber expectations.
To improve conversion rates:
- Ensure your landing pages deliver on the promise made in the email.
- Keep forms short and remove unnecessary steps.
- Use clear, action-oriented CTAs.
- Test different offers, messaging, and page layouts to identify what resonates most with your audience.
How To Calculate Conversion Rates
(Conversions ÷ Delivered Emails) × 100
The Cost of Losing Subscribers: Bounce, Spam, and Unsubscribe Rates
Losing subscribers hurts more than your email list size—it signals that something’s off in your email marketing strategy. Bounce rates, spam complaints, and unsubscribes offer a snapshot of your list’s health and how well your emails resonate with your audience. Ignoring these signs is like neglecting a check engine light.
Bounce rate
Bounce rates measure how many emails never made it to an inbox. Soft bounces (e.g., full inboxes) are temporary. Hard bounces, though, signal invalid addresses and can harm your sender reputation. Keep bounce rates under 2% by cleaning your list, verifying new addresses during signup, and steering clear of outdated or purchased lists.
How To Calculate Bounce Rates
(Bounced Emails ÷ Emails Sent) × 100
Spam complaints
These are much worse. Even a small spike can push your emails straight to the spam folder, regardless of your list’s quality. Stay below 0.1% by being upfront about what recipients can expect, making unsubscribe links easy to find, and avoiding spammy tactics.
If your sender reputation is already down, don’t worry. Tools like InboxAlly can rebuild trust and improve deliverability in just weeks. Go here to learn more about InboxAlly.
How To Calculate Spam Complaint Rates
(Spam Complaints ÷ Delivered Emails) × 100
Unsubscribes
Seeing subscribers leave is not inherently bad. An unsubscribe rate above 0.5%, though, could mean you’re sending irrelevant or overly frequent emails. Reduce churn by segmenting your audience and delivering content that matches their interests.
For inactive subscribers, re-engagement campaigns can work wonders. A simple “We miss you!” email or exclusive offer can rekindle interest while cleaning out the truly disengaged protects your deliverability.
Pay attention to these metrics, and your emails will land where they matter—in front of engaged, interested readers. Neglect them, and your email marketing campaigns might fail before they even begin.
How To Calculate Unsubscribe Rates
(Unsubscribes ÷ Delivered Emails) × 100
Revenue Metrics: Making Every Email Count
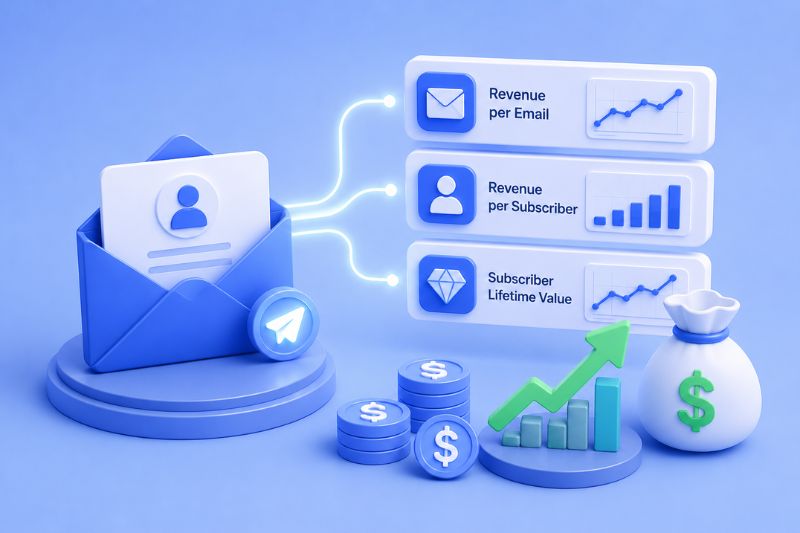
Engagement metrics tell part of the story, but the real question is: how much revenue are your emails generating? That’s where revenue-based metrics—revenue per email (RPE), revenue per subscriber (RPS), and subscriber lifetime value (SLV)—come into play. These figures reveal how well your strategy turns clicks into actual cash, connecting your email efforts directly to your bottom line.
- Revenue per email (RPE) gives you a quick snapshot of how much each email generates by dividing total campaign revenue by the number of emails sent.
- Revenue per subscriber (RPS) takes it up a notch, revealing which segments of your audience are the most valuable by dividing revenue by your active subscriber count.
- Subscriber lifetime value (SLV) looks at the long-term value each subscriber brings. This metric can help you forecast revenue and justify marketing investments.
But improving these metrics isn’t just about sending more. Here’s how you can boost these numbers:
- Segmentation: Create targeted content for different groups, like loyal customers or first-time buyers, to increase relevance.
- High-value offers: Provide incentives that align with your audience’s interests, such as exclusive deals or early access to products.
- Triggered emails: Automate campaigns like abandoned cart reminders or post-purchase thank-yous to convert at the right moment.
Tracking and refining these metrics takes you past basic engagement and connects every email to measurable revenue. This time, it’s all about quality, not quantity.
Engagement Over Time: Finding the Perfect Send Rhythm
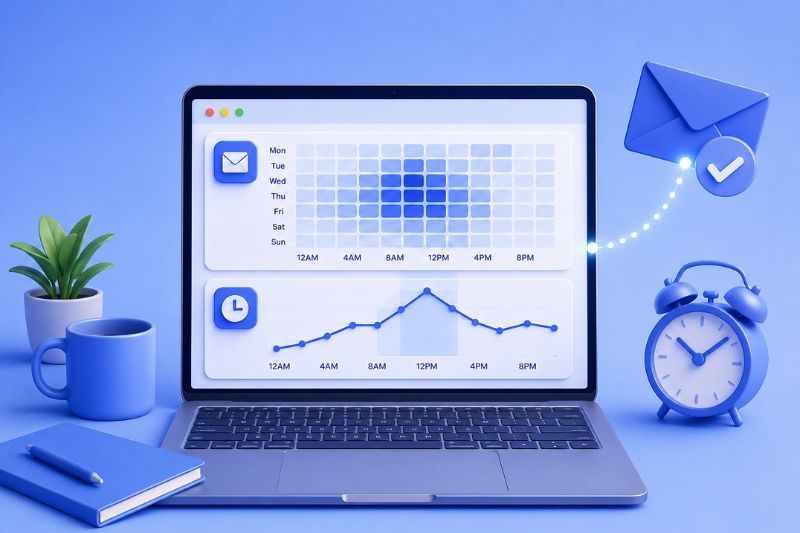
Timing can make or break an email campaign. You could have the perfect message, but if it lands in an inbox at the wrong moment, it’s as good as invisible. That’s why tracking engagement over time is essential—it lets you recognize patterns and figure out exactly when your audience is most likely to engage.
Tools to Uncover Timing Insights
- Heatmaps: These visually display when your emails receive the most opens and clicks, which helps you pinpoint engagement peaks.
- Time-of-day analysis: This shows you when your audience is most active, which helps with identifying the best hours to send emails.
For example, if your audience engages most around 9 a.m., but you’re sending emails at 6 p.m., you’re missing a golden opportunity. Align your send times with these patterns, and you could improve engagement by as much as 20%.
Why Frequency Matters
Frequency can be just as tricky as timing. Bombard your audience, and you’ll wear them out, which can lead to unsubscribes, email fatigue, or even spam complaints. But go quiet for too long, and your audience might forget you exist.
The solution lies in finding the right balance. Consistency matters, but it should match your audience’s preferences. Tracking open rates and analyzing trends helps you adjust how often you reach out. Send emails when your audience is both active and receptive, and your campaigns will feel like a natural part of their day.
With the right timing and cadence, your emails become part of your audience’s routine, which boosts their impact and effectiveness. It’s not everything, but it sure does matter.
Measuring Subscriber Acquisition Costs and Lifetime Value
Subscriber acquisition cost (SAC) and subscriber lifetime value (SLV) are like two sides of the same coin—they show the cost and return of your email marketing efforts. SAC measures what it takes to bring a new subscriber on board, including ad spend, content creation, and other costs. SLV tells you how much revenue subscribers generate during their time on your list.
The magic happens when these numbers work together. For example, if your SLV is $300 and your SAC is $50, you’re in great shape. But if SAC starts getting higher, you’re likely overspending to attract subscribers who won’t pay off in the long run.
How do you keep this balance? Focus on smart acquisition and smarter retention. Use high-quality channels to attract the right people—those likely to engage and convert. Then, nurture them with personalized campaigns and offers tailored to their needs.
The goal is simple: keep SAC low and SLV high. When you do, email marketing pays for itself and becomes a powerful growth tool that drives profitability over time.
How To Calculate Subscriber Lifetime Value
Average Revenue per Subscriber × Average Subscriber Lifespan
How To Calculate Subscriber Acquisition Cost
Total Acquisition Costs ÷ New Subscribers Acquired
Final Thoughts
Email engagement metrics are more than numbers—they’re the blueprint for smarter campaigns and better results. Whether it’s fine-tuning your subject lines, optimizing send times, or improving click-through rates, these numbers hold the power to reshape your email strategy.
But metrics alone won’t do the work. Success comes from what you do with them. Stay curious, test new ideas, and keep evolving with your audience. Progress, not perfection, is what drives long-term growth.
And if you’re struggling to get your emails into inboxes where they belong, can help! It takes the guesswork out of deliverability and engagement, giving you the edge to make every campaign hit its mark.
Ready to see the difference firsthand? Check out InboxAlly today!