
Most marketers track email delivery rates, but that number is misleading. Just because an email is “delivered” doesn’t mean it reaches the inbox, and inbox placement is what actually determines whether your campaigns generate revenue. With spam filtering becoming more aggressive across Gmail, Outlook, and Yahoo, a growing share of legitimate emails never get seen at all.
That’s why email deliverability statistics matter. They reveal the gap between technical delivery and real visibility, showing how factors like engagement, authentication, and sender reputation directly impact performance. Below are the most important email deliverability benchmarks for 2026, covering inbox placement rates, spam filtering behavior, and the metrics that actually influence whether your emails get opened or ignored.
Quick Answer
While the global average often hovers about 83% as a result of strong automatic filters, a healthy email deliverability rate typically runs between 95% and 99%. This deliverability disparity causes almost one in six genuine marketing emails not to arrive in the main inbox.
1. General Email Deliverability Statistics
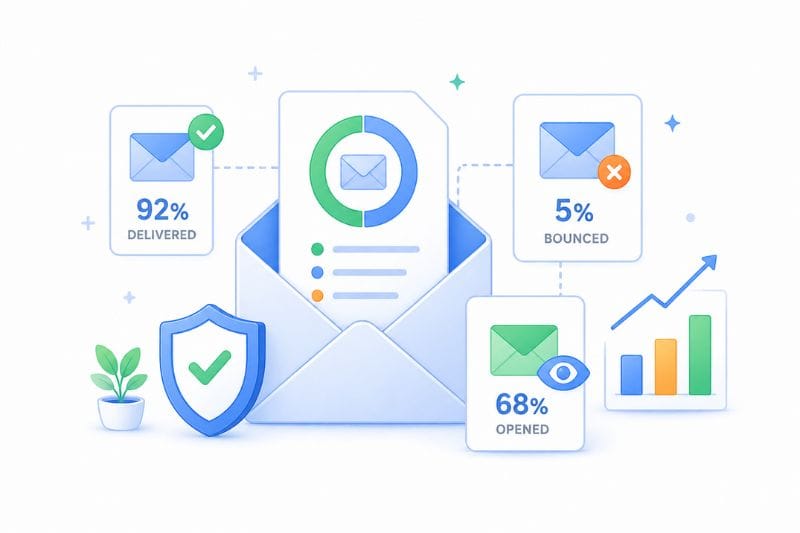
1. ~83% Global Inbox Placement Rate
Industry benchmarks report show that roughly 17% of permission-based marketing emails fail to land in the inbox. Many are routed to spam or blocked entirely, meaning nearly 1 in 6 emails has zero chance of being seen or generating revenue.
2. 10% Average Spam Folder Distribution
Around 1 in 10 emails accepted by receiving mail servers still end up in the spam folder. So even when a message is technically delivered, it often never reaches the recipient’s primary inbox or gets read.
3. ~98% Technical Delivery Rate vs. Placement
Many email marketers report delivery rates above 98.5%, but that only reflects server acceptance, not visibility. A significant portion of those emails still miss the inbox, which is why inbox placement, not delivery rate, is the metric that actually matters.
4. 2% Bounce Rate Warning Sign
Bounce rates above 2% often point to old lists or poor subscriber data. Once bounce rates rise, mailbox providers may start treating future emails with more suspicion.
5. 424 Billion Emails Sent Daily
Around 424 billion emails are expected to be sent and received worldwide each day. With that much volume, ISPs heavily rely on more aggressive spam filtering to protect email recipients.
6. 0.1% Critical Spam Complaint Threshold
Public guidance from Gmail and Yahoo indicates that placement rates drop rapidly once spam complaints exceed 0.1%. Keeping this rate low is essential for a positive sender reputation.
7. 20%–25% Average Email Open Rate
Across numerous industries, email open rates usually fall between 20% and 25%. Since engagement is a key ranking signal, consistently low open rates can signal to providers that your emails are not valuable to recipients.
8. 0.5% Target Unsubscribe Rate
High-performing email programs typically keep unsubscribe rates below 0.5%. Higher rates often indicate poor targeting or irrelevant content, both of which can negatively affect sender reputation over time.
9. 60%+ of Email Opens Happen on Mobile
More than 60% of email opens now happen on mobile devices in many sectors. If an email looks awkward on a phone, readers often move on quickly. Therefore, making mobile rendering a critical factor in campaign optimization.
10. 1 in 6 Emails Miss the Inbox
With inbox placement averaging 83%, roughly 1 in 6 legitimate emails misses the inbox altogether. Some go to spam, while others never appear anywhere.
11. 34%+ of Users Flag Emails Based on Subject Line
Around one-third of recipients may mark an email as spam based on the subject line alone. This makes subject line quality a critical factor, not just for open rates, but for protecting sender reputation.
12. 2%—3% Industry Average Click-Through Rate
Many industries see average click-through rates between 2% and 3%. When hardly anyone clicks, providers may read that as a sign of low interest.
13. 26% Higher Opens with Personalization
Open rates for marketing emails with tailored subject lines can be about 26% greater. Readers are more prone to interact when messages seem to be more relevant. Long-term deliverability problems might result from low engagement.
14. 3 Seconds: The Maximum Load Time
Emails that take longer than three seconds to load see a 50% increase in deletion rates. This technical lag can indirectly hurt your sender reputation scores.
15. 78.5% of Marketers Call Deliverability Critical
Nearly 80% of marketers rate deliverability as highly important, yet many still prioritize content over inbox placement. This gap often leads to strong campaigns that never reach their audience.
2. Gmail and Yahoo Benchmarks
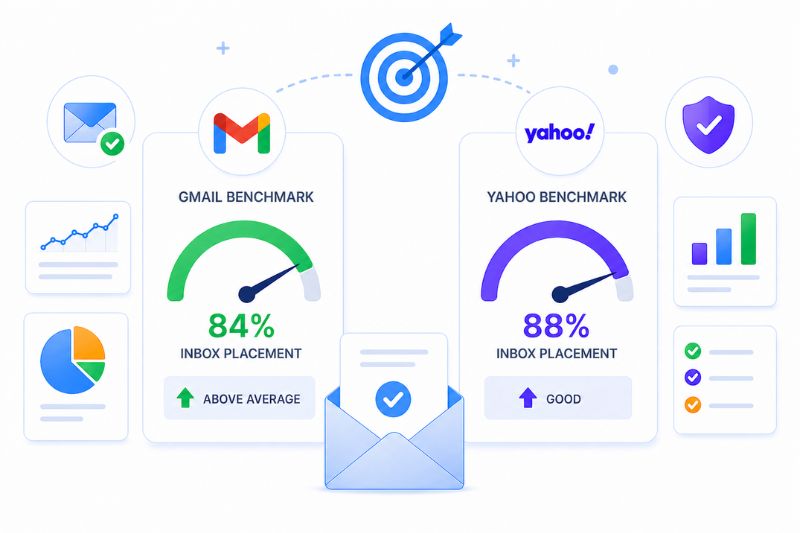
16. ~83–85% Gmail Inbox Placement
High-performing email senders with optimized deliverability infrastructure usually hit between the range of 83% to 85%. That means even well-optimized senders still lose a meaningful share of emails to spam or other tabs, making Gmail one of the primary bottlenecks for deliverability.
17. ~75–80% Outlook Placement Rate
Outlook tends to be stricter, in its inbox placement reports often landing between 75% and 80%, especially for bulk or promotional emails sent at scale.
18. ~86–90% Yahoo Mail Placement Rate
Yahoo Mail generally places around 86% to 90% of emails in the inbox, with authentication playing a big role in whether messages pass through cleanly.
19. 40–60% Promotions Tab Distribution
A large portion of commercial email marketing campaigns (roughly 40% to 60%), is automatically sorted into the Promotions tab. While this isn’t spam filtering, it still reduces visibility and can significantly lower open rates compared to Primary inbox placement.
20. 5,000 Daily Message Authentication Threshold
Gmail and Yahoo have moved to stricter authentication requirements for bulk senders delivering more than 5,000 messages per day. At this volume, missing or misconfigured authentication can lead to immediate filtering or rejection.
21. Misalignment Leads to Significant Placement Loss
Failing to align SPF and DKIM records often leads to a large portion of mail going to spam folders. Prioritizing authentication implementation is key to email marketing success.
22. 0.3% Hard Cap on Spam Complaints
While 0.1% is the target, reaching 0.3% is considered a “red zone” by Gmail. At this level, your deliverability rate will face immediate throttling.
23. 80% of Gmail Users Utilize Tabs
Since ~80% of Gmail users have “Categories” enabled, landing in the “Primary” tab is the ultimate goal for email marketers.
24. 90-Day Engagement Window Influences Placement
Gmail often looks at roughly a 90-day engagement window, meaning how users interact with your emails over the last few months can affect where future emails land. Poor engagement during this period can cause even previously healthy senders to see declining inbox placement.
If you’re unsure where your emails are actually landing, that’s where InboxAlly comes in—it allows you to monitor inbox placement and identify issues before they impact performance. Start your 10-day free trial.
3. Email Marketing ROI and Performance Stats
25. 1% Inbox Placement Gain Can Lift Revenue by 2%–3%
Even a small improvement in inbox placement, just 1% better delivery to the inbox, is often linked to a 2% to 3% increase in revenue, since more real people actually see the emails. At scale, even marginal gains in deliverability can translate into significant revenue increases across large campaigns.
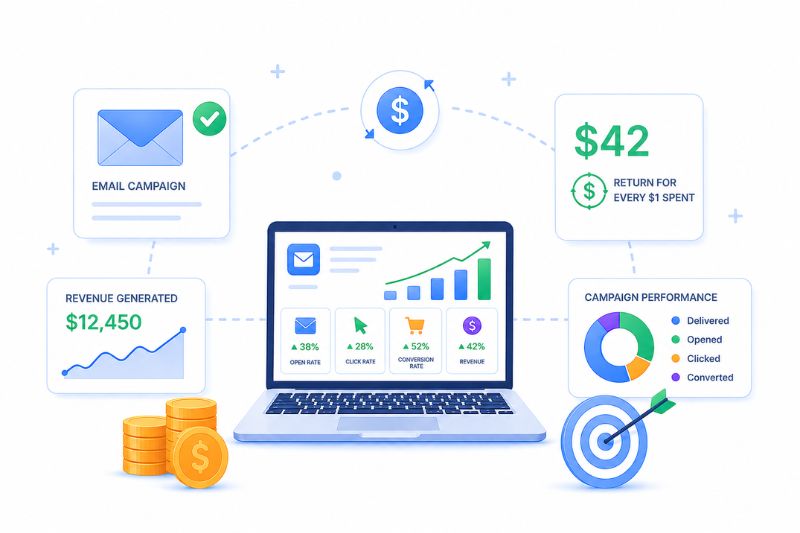
26. Marketing Emails Can Return Around $36 for Every $1 Spent
On average, email marketing brings in about $36 for every $1 spent, but that return depends heavily on whether emails actually reach the inbox. If deliverability drops, this ROI declines just as quickly, making inbox placement a direct driver of performance.
27. 4–8 Weeks for Reputation Recovery
If sender reputation drops, it usually takes around 4 to 8 weeks of steady, careful sending before mailbox providers start trusting the domain again.
28. Sender Scores Below 80 Often Face Filtering Issues
Many sending systems use a score out of 100, and when that score drops below 80, emails are more likely to slow down or land in spam. Once scores fall below this threshold, recovery becomes progressively harder without active intervention.
29. $42 Return for Every $1 Spent
The email marketing roi remains the highest of any digital channel for senders who maintain an average email deliverability rate above 90%.
30. 14% Higher Open Rates for Segmented Lists
Emails sent to segmented lists often get around 14% more engagement, since people are receiving content that actually matches their interests.
31. Re-Engagement Campaigns Can Recover Up to 20% Revenue
Win-back or re-engagement campaigns can bring back roughly 20% of lost revenue potential by reconnecting with inactive subscribers. These campaigns also help improve engagement signals, which can positively influence future inbox placement.
4. Sector-Specific Benchmarks
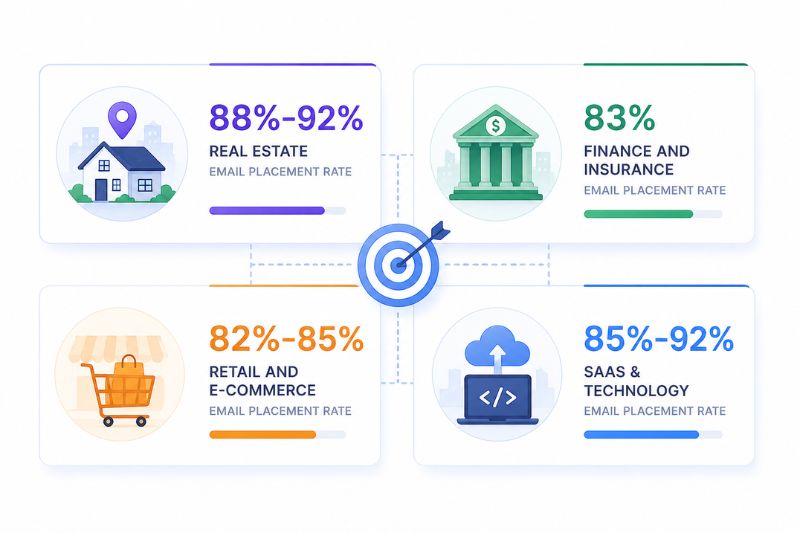
32. ~88%–92% Real Estate Email Placement Rate
Real estate email campaigns often see inbox placement around 88% to 92%, partly because messages tend to be less frequent and more targeted compared to other industries.
33. ~83% Finance and Insurance Placement Rate
Finance and insurance emails usually sit lower, around 83% inbox placement, since these industries face stricter spam filtering due to stringent security rules and sensitive keywords in their personalized emails. This makes compliance, authentication, and content control especially critical in maintaining deliverability in these sectors.
34. ~82%–85% Retail and E-commerce Placement Rate
Retail and e-commerce brands typically see around 82% to 85% inbox placement, but targeted campaigns can lead to more frequent deliverability problems. High sending frequency and promotional content increase filtering risk, making list quality and engagement management essential.
35. ~85%–92% SaaS & Technology Placement Rate
SaaS and technology companies usually perform better, with inbox placement around 85% to 92%, especially when sending transactional or product-related emails.
5. Authentication and Technical Stats
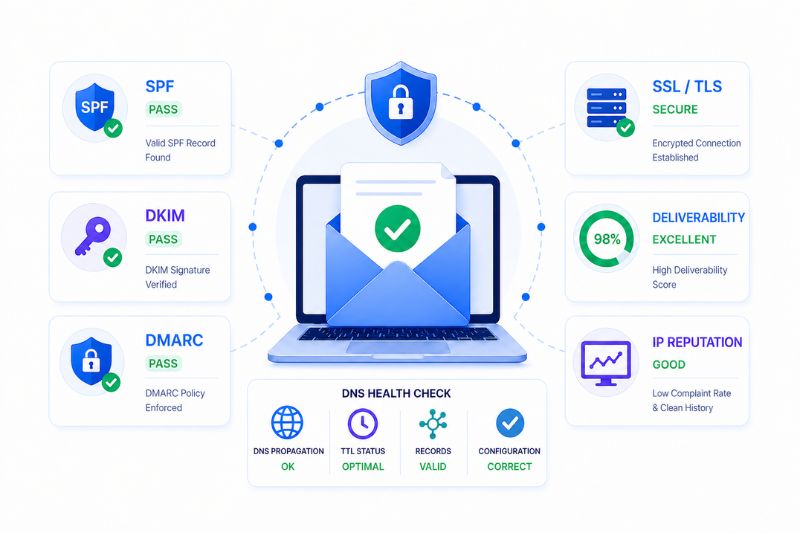
36. 100% SPF and DKIM Alignment Requirement
Google’s postmaster guidelines mandate a 100% alignment requirement for SPF/DKIM for bulk senders. Failure to align these records can result in immediate rejection by incoming servers. At scale, even small misconfigurations can cause large portions of email volume to fail or be filtered.
37. Around 35% of Domains Have Fully Enforced DMARC (p=reject)
Only about 35% of domains with DMARC records actually enforce it at the “reject” level, which is the strict setting needed to fully block spoofing attempts. This gap creates both a security risk and a deliverability disadvantage for brands that don’t fully enforce authentication.
38. Bounce Rates Below 2% Are Considered Healthy
Most email programs aim to keep bounce rates below 2%, since higher bounce levels often signal outdated or low-quality email lists.
39. About 6%–10% of Emails Are Lost or Filtered Before Inbox Delivery
Even after sending, a noticeable portion of emails, around 6% to 10%, never reach either inbox or spam, often due to filtering or blocking systems. This “invisible loss” makes it difficult for senders to accurately measure performance without proper inbox placement tracking.
40. 96% Success Rate with Warm-up Optimization
Research shows a 90% success rate with warm-up optimization when moving to a new IP. A properly executed warm-up ensures that receiving mail servers accept your volume without immediate throttling.
41. 98% Inboxing for Dedicated IPs
Senders with high volume move to a dedicated IP to see their inbox placement stabilize at 98%+. However, dedicated IPs require consistent volume and proper management; otherwise, performance can degrade quickly.
42. Only About 33% of Top Websites Use Proper DMARC Records
Roughly one-third of major domains have correctly configured DMARC records, leaving many brands exposed to spoofing and deliverability issues.
43. SPF Is Used by the Majority of Legitimate Email-Sending Domains
Technical deliverability infrastructure starts with SPF. It is the most basic and widely adopted form of email authentication.
44. 25% Open Rate Increase with Double Opt-in
While it slows list growth, double opt-in helps in making sure that your email recipients are highly engaged, leading to better long-term stats. Higher engagement from cleaner lists also strengthens sender reputation over time.
45. Gmail Postmaster Tools Are Essential for Monitoring Reputation
Usage data indicates a 100% criticality for Gmail Postmaster Tools for bulk senders monitoring domain reputation. Top senders rely on tools like Gmail Postmaster to track spam rates, domain reputation, and delivery issues in real time.
Stop Leaving Your Revenue to Chance
The latest email deliverability statistics prove that success is a moving target. Monitoring your email marketing statistics is the first step to ensuring you actually reach customers. By sticking to proper authentication and maintaining your sender reputation, you can keep your sales growing and stay out of the spam folder.
If you want to see where your emails are really landing, InboxAlly helps you track inbox placement and identify issues before they impact your campaigns. Start your free trial and take control of your deliverability.