Despite the growing popularity of social media and the rapidly developing marketing technologies, email marketing is still alive and is the most mature player in the digital marketing sphere.

It just gives you that avenue to have genuine and intimate interactions that other digital channels cannot compare to.

And with over 319.6 billion global emails sent daily in 2021, data proves that email marketing is still a powerful tool with unmatched reach. 

More so that face-to-face communication was scarce during the pandemic. Marketing professionals pivot toward more emailing. Plus, email marketing is a channel with fantastic ROI (more on this later).

So, are you excited to learn the most important email marketing statistics in 2022? Find them all here and use the data to boost your email marketing campaigns.

Let’s kick off this post with the…

1. Total Potential Email Reach and Demographics 2022

A person holding an iPhone displaying the inbox app for monitoring Email Marketing Statistics.

Average Email Open Rates

The average open rate varies depending on the source. According to Campaign Monitor, it’s 18% but GetResponse shares it’s 22.15%.

A bar graph illustrating the usage percentage of social media among individuals.

Average out these numbers and you get a 20.56% open rate across four major email marketing platforms. 

Wait, their number varies. Does it mean that one email marketing service provider is better than the other? Not really. It likely just represents a discrepancy in how thoroughly and how often their users purge inactive readers/ subscribers from their email list.

Opens By Environment: Top Devices People Use to Open Their Emails

A group of people analyzing email marketing statistics on laptops at a table.

What about device differences? Below we highlight the top devices that people use to open their emails.

Mobile

It’s no secret that more people are opening their emails on tablets and phones than ever before. One study even found that 49% of all emails globally are opened on a mobile device, leading to an entire field called mobile email marketing.

A pie chart showing the percentage of online dating in India.

Campaign Monitor even mentioned in its Email Trends Report that one out of every 3 clicks in an email occurs on mobile devices.

Mobile email marketing is more than email. It covers how a brand will utilize smartphones to promote its products or services. Marketers likewise use geographical data and event-driven email for this kind of email marketing campaign.

Desktop Apps and Web Apps

The remaining 51% is split with email opens in desktop apps and web apps. This means that you have to consider this when writing your subject lines and designing your newsletters.

Did you also know that if an email is read first on a mobile device and then opened for a second time on a desktop, that subscriber is 65% likely to click through?

Welcome Email is Still the King of Engagement

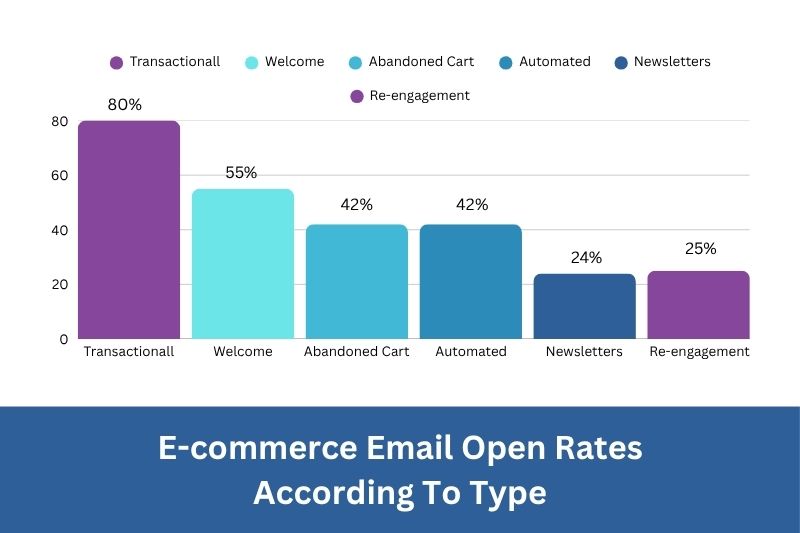
Of all types of email, welcome emails have the highest (91.43%) open rate and an average click-through rate of 26.9%. These statistics show that welcome email is still the king of engagement, outperforming other email marketing types.

Frankly, it’s close to impossible to get this type of success rate or opportunity ever again so you have to make the most of your welcome emails.

Do know that when a customer takes the effort and time to sign up to your email list, it signals that your brand resonates with them.

Other common types of emails compared are newsletter emails, survey emails, promotional emails, milestone emails, and lead nurturing emails.

Age Group that Uses Email the Most


A group of people using laptops for email marketing analysis.

Millennials are spending more hours on their email daily – more than the other generations, according to Adobe’s Consumer Email Survey.

In that survey about email habits that involved over 1,000 adults, people aged 18-24 years old they checked their work emails while in bed (44%), in the bathroom (33%), during a meal with others (19%), working out (14%), or while in a face-to-face conversation with someone (12%).

Millennials and Gen-Z are the generations that are most obsessed with reaching “Inbox Zero,” an approach to email management aimed at keeping the inbox almost empty (if not empty) at all times. It also means responding, delegating, or deleting an email the soonest it is received.

A graph displaying car speed statistics.

2. Email Segmentation Statistics

A laptop screen displaying an email with statistics.

Email segmentation is the division of email subscribers into smaller segments according to set criteria. Thanks to this strategy, it gave campaigns a significant boost.

In fact, 58% of revenue is generated because of personalized and segmented emails. Personalized subject lines moreover produced a 65% open rate in the travel industry.

Segmented Campaigns vs. Non-Segmented Counterparts

Mailchimp claims that segmented campaigns performed better compared to their non-segmented counterparts, as follows:

A compilation of email marketing statistics.

The 2021 Email Client Market Share

After tracking billions of email opens in the past year to know where subscribers are reading their emails, the following are the top email clients as of 2021.

  1. Apple iPhone: 38.9%
  2. Gmail: 27.2%
  3. Apple Mail: 11.5%
  4. Outlook: 7.8%
  5. Yahoo! Mail: 5.4%
  6. Google Android: 1.5%
  7. Apple iPad: 1.4%
  8. Samsung Mail: 1.2%
  9. Outlook.com: 0.9%
  10. Outlook Mobile: 0.2%

3. Visual Content in Email Campaigns

A woman multitasking with her laptop and phone, possibly for email marketing or analyzing statistics.

While it is true that safe email is still a plain-text email (plain words as they arrive without images and embedded links), your opportunities as a marketer are endless when using engaging email templates.

Foresign Factory’s Challenge for Brands even detailed that 45% of consumers prefer brands that do not take themselves too seriously – a signal for firms to position themselves as genuine and approachable.

So you want to spice up your content? Use videos, emojis, or images in your email marketing campaign.

Videos

When you embed a video in your (initial) email marketing campaign, it has the potential to receive a 96% increase in click-through rates. Yup, trends favor video!

Other interesting email marketing statistics relating to the use of video are as follows:

  • 78% of marketers using video claimed it has directly helped increase their sales.
  • 60% of businesses nowadays use video as their marketing tool.
  • Attaching a video in an email marketing campaign leads to a 200-300% CTR increase.
  • 94% of users report watching a video to learn more about a product and 84% are swayed to make a purchase.
  • The majority of people (84%) watch videos on a desktop, while 14% watch them on mobile devices.
  • Using the word “video” boosts open click-through rates by 65%, opens rates by 19%, and reduces unsubscribe rates to 26%.

Take advantage of this information right away and see results. You’ll thank us later.

Emojis

Emoji use has grown so much to illustrate a language to a joke of its own. It has become a key that people communicate their feelings and emotions online.

Pre-pandemic, the top emojis by subject line appearances include the Registered sign, grinning face, smiling face with heart-shaped eyes, red heart, smiling face with open mouth, and sun with rays emojis.

Then comes 2021, the face with tears of joy emoji ranked as first followed by red heart, rolling on the floor laughing, and a thumbs up. Data was released by the Unicode Consortium.

Pictures

Of course, our email marketing statistics would not be complete without highlighting the importance of pictures. After all, email’s appearance matters.

And so, let’s begin our email marketing stats in this category by HubSpot’s State of Marketing Report 2021. It shares that two-thirds of surveyed individuals prefer emails that comprise pictures.

Moreover, emails that contain a sort of graphics have a higher CTR (4.5%) and open rate (27%) vs plain text emails (3% and 20%, respectively).

Still, the size of the picture matters as 74% of email readers delete the message if it won’t open within 5 seconds. Most likely, this happens because the size of the photo in an email is too big.

The best email marketing practice when it comes to attaching images for email is to use 600px to 650px dimensions. But be sure to run plenty of tests for the said screen resolution to make sure that it looks right on different platforms, be it opened via a mobile device or browser.

It is likewise best to keep the text-to-image ratio 4:1.

4. Email Engagement During the Pandemic

A person holding a phone displaying COVID-19 statistics.

It’s incredibly clear by now that many people are comfortable with using email. They have almost integrated it into many aspects of their day.

Then, Covid-19 hit the world. The pandemic created unexpected challenges for email marketers as the widespread stay-at-home orders and economic turmoil have produced unpredictable consumer behaviors.

Covid-19 Changed Brand’s Email Marketing Strategy

As email volume grew, brands also had to find ways (like using a new email marketing strategy) to stand out in crowded inboxes. In fact, 49.7% of senders shared they adapted a new email strategy due to the Covid-19 pandemic.

Said changes in their strategy did not, however, translate into changes in their email budget. About 60.6% of senders said their budget for email communications stayed the same, 27.1% said it increased, while 12.4% said it decreased during the past year.

More People Are Opening Their Email During the Pandemic

Meanwhile, Campaign Monitor’s Email Marketing Benchmarks for the Covid-19 Edition showed how more people are opening their emails during the pandemic.

March 2020, particularly, saw a rise in almost 3 points over February of the same year. And in March and April, opens continue to increase.

Essential Industries Send More Emails and Get Fewer Unsubscribes

Unsurprisingly, e-mail marketing campaigns from vital industries during the pandemic, such as Healthcare, Financial Services, Nonprofits, and Government have increased their sending more than ever.

These essential industries likewise saw an increase in their open rates. Some of these industries, such as the Government, have fewer unsubscribe rates. It was 38% lower unsubscribes for the Government senders in 2020.

Email Frequency: Now vs. Pre-Pandemic

When asked how often they send their announcement or marketing emails to their subscribers during the pandemic, over 55.6% of the brands surveyed said they do it once a month pre-pandemic. That number dropped to 40.2% now.

It was observed in the survey that email senders are more likely to send their campaigns at least twice a month, which is 19.3% vs. 24.3% now. Or they send once per week ((14.2% pre-pandemic vs. 17% now).

5. Email Marketing ROI Statistics

A laptop displaying email marketing statistics, placed on a table.

Email marketing delivers a strong return on investment.

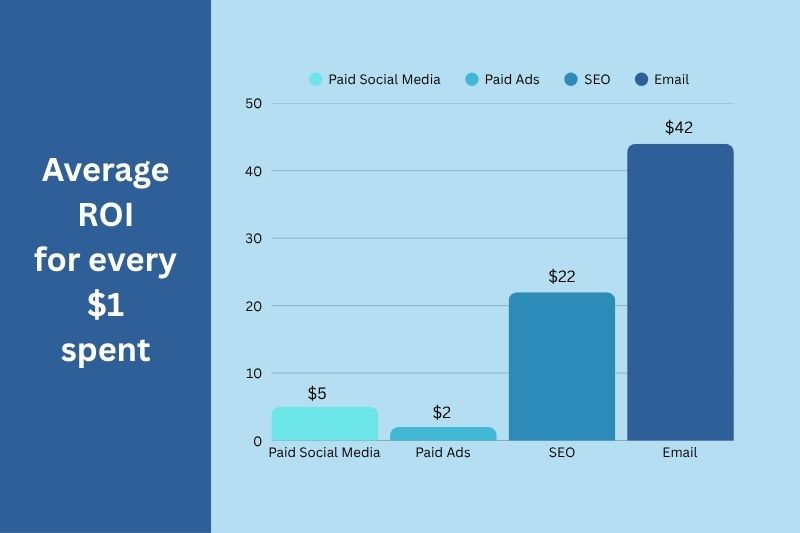
It generates $42 for every $1 spent or an astounding 4,200% return on investment, making email marketing one of the top forms of marketing in 2022. 

In addition, traffic from email campaigns boasts an impressive average conversion rate of 4.29%.

This is higher than the conversion rate averages for traffic from social media (1.81%), direct (2.93%), and search (3.04%), based on WordStream general email marketing statistics.

In an email marketing consensus, 73% of marketers rated email marketing ROI to be “Excellent” or “Good.”

An effective email marketing campaign can also help email marketers or businesses, in general, accomplish the following goals:

  • Visualize their email campaign on a large scale and know where each campaign fits their overall business goals,
  • Properly integrate email marketing into their marketing mix, and
  • Optimize email marketing ROI

[You may also like: What is the ROI of Email Marketing and 7 Hacks on How to Boost It]

Automated Email Messages Convert Better than Traditional Emails

Marketers love automated email messages since they are set up only one time and are automatically sent to audiences on certain event triggers. Apparently, customers like them too!

Automated email messages even have 150% more click-through rates and 70.5% higher open rates compared to “business as usual” emails. 

Not bad at all for something that does not even require that much effort than writing an email from scratch.

Moreover, emails triggered by a person’s purchase behavior – also called transactional emails – have 8x more clicks and opens than other types of emails. These kinds of emails also have the potential to generate 6x more revenue.

Maximizing ROI with Cart Abandonment Emails

For online retailers and businesses, cart abandonment is a real problem. Come to think of it, a potential client is already on the verge of buying the product but decided not to in the last possible second.

survey of online shoppers conducted by Statista revealed the common reasons why online shoppers leave without paying.

And the primary reason is the cost of delivery was higher than anticipated (41%), followed by just comparing prices (29%), deciding they didn’t want the product (29%), the item was out of stock (28%), or estimated delivery time was too long (26%).

So, what should you do?

One of the best ways is to re-target these audiences through a series of emails so they will eventually complete the checkout process. Make sure you don’t delay this process.

Some companies use an email autoresponder to automatically target those who abandon their shopping carts.

Online horse supplies provider SmartPak Equine shares that cart abandonment emails earned them an average of 50% conversion rate for those who click-through and $4.80 revenue per email.

Even in 2021, cart abandonment open rates remained at a solid 42.3%.

Of course, time is of the essence when it comes to using this email strategy. You only have a small window to send the abandoned cart email campaign after someone leaves their shopping cart.

It is also worth noting that the fashion industry enjoys the highest sales uplift (6.38%) from cart abandonment emails. It is followed by sports and outdoor (4.65%), health and beauty (4.11%), groceries (3.97%), and consumer electronics (2.91%).

The average sales uplift across all retail types was at 4.43%.

Now, that’s pretty cool!

6. B2B vs. B2C Email Marketing Statistics

You probably already know that B2B (business-to-business) email marketing is a different beast than B2C (business-to-consumer). Of course, there are overlaps (like techniques to stay out of the spam filter).

That being said, you can expect the B2B and B2C email marketing statistics to differ. For instance…

Email is a Top 3 Organic Content Distribution Channels B2B Marketers Used

A 2020 research revealed that 87% of B2B marketers use email as their organic content distribution channel. Email is the top 3 among other distribution channels, whereas social media (91%) and B2B marketers’ organization website/blog (89%) ranked as Top 1 and 2, respectively.

The same study found that 79% of B2C marketers use email to distribute their articles or blog posts.

Higher Opens If You Won’t Send More than 5 Newsletters a Week

For B2C email marketers, remember that your subscribers will reward you with higher click and open rates if you won’t send more than 5 newsletters per week.

7. What Marketers and Brands Get Wrong About Email Marketing

A group of people discussing email marketing statistics around a conference table.

Mistake #1: Over-Sending Emails

And now… to make sure you are not breaking any cardinal email marketing rules, you should avoid over-sending emails.

In a survey done by TechnologyAdvice, they asked hundreds of US adults for what reasons they would mark emails as spam and 45.8% of them said because “they emailed too often.”

Other reasons why subscribers flag emails as spam are that they didn’t purposely subscribe (36.45), marketers sent irrelevant content (31.6%), their emails were impersonal (10.4%), and the remaining 18.6% said none of the above.

Mistake #2: Using Email Cliches

research commissioned by Perkbox Insights found that “As per my last email” and “Just looping in” are the most annoying email cliches with 37% of respondents saying they find it “annoying” when those phrases are used in an email.

Moreover, 16% think that using an exclamation mark in a work email is never acceptable.

Mistake #3: Not Having a Clear Call-to-Action (CTA)

Words matter in email marketing. So, if your CTA is vague or boring, readers are likely to skip right over it.

In addition, emails with a clear and single CTA receive 371% more clicks compared to those emails that use multiple CTAs. To measure the basic metrics of your email marketing campaign performance, including the effectiveness of your CTA, you need to do an A/B test.

Mistake #4: Crowding and Over Designing Your Email Content

Although having dynamic content is good, especially for marketers who are serious with personalization, over designing your email content could backfire. Not meeting the standard image-to-text ratio may cause ISP to identify your email as spam.

At the very least, avoid giving the image/video more than 40% exposure in your email. Leave 60% area in your layout for the text.

8. Tips for Improving Your Email Marketing Stats

Writing Catchy Email Subject Line, Content, and Sign-Offs that Convert

To improve your email marketing statistics, you should be able to write an excellent email subject line, email content, and sign-offs (You know, those “Thanks” or “Regards”). This is because these elements in your marketing emails will define whether a reader will convert into a paying customer.

“Money is in the (email) list,” experts say and they’re absolutely correct.

Your subject lines can make or break your campaign, such that 47% of email recipients open an email based on the subject line alone. In the same manner, 69% of customers can report an email as spam based on a subject line too!

Here are other statistics that may be useful for you:

  • Emails with “FW:” in the subject line were 17% less likely to be opened than those without.
  • Personalized email subject lines are 22% more likely to be opened.
  • Emails without subject lines – as long as they come from legitimate sources) were intriguing in that they generated an 8% higher open rate than those with a subject line.
  • Using the words “Thank You” in a subject line can net a higher-than-average open rate.
  • The most popular email sign-offs are: “Thanks” (62%), just a name or initials (46%), “Sincerely” (44%), “Love” (28%), “Regards” (22%), and no signature at all (21%).

[You may also like: 3 Key Elements of Irresistible Email Subject Lines]

Know Your Ideal Email Frequency and Timing

Another best practice to improve your email marketing statistics for 2022 is to know when is the best time to send an email. According to CoSchedule, the best day to send an email is on Tuesday.

And if you’re sending two emails per week, choose Thursday as your second day. As for the worst click-through and open rates are on weekends.

Use Data to Boost Your Email Marketing Campaigns

And that’s a wrap.

Now, it’s time to use these 2022 statistics to boost your email marketing efforts. From email scheduling to email tracking, automated follow-ups to email personalization and segmentation. These email marketing statistics just prove how valuable emails are for your business.

Good luck and happy sending!

Want to take your email marketing to the next level? Check out some of InboxAlly’s resources today.

Resources:

  1. https://www.statista.com/statistics/456500/daily-number-of-e-mails-worldwide/
  2. https://www.campaignmonitor.com/resources/guides/email-marketing-benchmarks/
  3. https://www.getresponse.com/resources/reports/email-marketing-benchmarks
  4. https://www.litmus.com/blog/infographic-the-2019-email-client-market-share/
  5. https://www.campaignmonitor.com/resources/guides/email-marketing-trends/
  6. https://blog.hive.co/the-most-mind-blowing-email-stats-of-2018/#
  7. https://www.cnbc.com/2018/08/22/millennials-spend-more-time-on-their-email-than-any-other-generation.html
  8. https://www.activetrail.com/marketing_blog/marketing_automation_articles/amazing-email-personalization-statistics-infographic/
  9. https://mailchimp.com/resources/effects-of-list-segmentation-on-email-marketing-stats/
  10. https://www.litmus.com/blog/email-client-market-share-2021-q1/
  11. https://www.foresightfactory.co/why-brands-need-to-be-more-human/
  12. https://www.wordstream.com/blog/ws/2017/03/08/video-marketing-statistics
  13. https://www.wyzowl.com/video-marketing-statistics-2018/
  14. https://biteable.com/blog/video-marketing-statistics/
  15. https://www.forrester.com/report/As-Seen-In-The-Inbox/RES54235
  16. https://blog.hubspot.com/marketing/state-of-video-marketing-new-data
  17. https://blog.hubspot.com/marketing/video-marketing-statistics
  18. http://syndacast.com/video-marketing-statistics-trends-2015/
  19. https://mailchimp.com/resources/mailchimps-most-popular-subject-line-emojis/
  20. https://www.indiatoday.in/technology/news/story/this-is-the-most-used-emoji-of-2021-and-we-are-not-surprised-1884300-2021-12-05
  21. http://syndacast.com/video-marketing-statistics-trends-2015/
  22. https://www.delivra.com/resources/blog/best-image-size-email-newsletters-2019/
  23. https://www.mailgun.com/blog/how-covid-affected-email-sending/
  24. https://www.campaignmonitor.com/resources/guides/covid-19-email-benchmarks/
  25. https://www.litmus.com/resources/email-marketing-roi/
  26. https://www.wordstream.com/blog/ws/2018/07/19/advertising-statistics
  27. https://www.salecycle.com/blog/stats/18-essential-email-marketing-statistics/
  28. https://moosend.com/blog/10-marketing-automation-statistics-need-know/
  29. https://www.statista.com/statistics/692771/online-shopping-primary-reasons-to-abandon-carts/
  30. https://www.marketingsherpa.com/article/case-study/175-more-revenue-83-higher
  31. https://www.barilliance.com/cart-abandonment-rate-statistics/
  32. https://www.salecycle.com/blog/stats/18-essential-email-marketing-statistics/
  33. https://contentmarketinginstitute.com/2019/10/success-differentiators-b2b-research/
  34. https://www.getresponse.com/resources/reports/email-marketing-benchmarks#location-industry
  35. https://technologyadvice.com/blog/marketing/marketing-email-preferences-2015/
  36. https://www.perkbox.com/uk/resources/blog/most-annoying-things-in-an-email-ranked
  37. https://www.wordstream.com/blog/ws/2015/06/10/digital-marketing-stats
  38. https://www.mailpro.com/blog/post/importance-of-image-to-text-ratio-in-newsletters#
  39. https://optinmonster.com/101-email-subject-lines-your-subscribers-cant-resist/
  40. https://www.invespcro.com/blog/email-subject-lines-statistics-and-trends/
  41. https://www.omnicoreagency.com/digital-marketing-statistics/
  42. https://www.huffpost.com/entry/email-sign-off-poll_n_56ead0fee4b0860f99dbc472
  43. https://coschedule.com/blog/best-time-to-send-email
  44. https://optinmonster.com/the-best-time-to-send-emails-heres-what-studies-show/